Geographical Data Visualization for Avanto Insight

In the spring 2012, Johan Björn and Raimo Muurinen, the guys of Avanto Insight Oy, asked several companies to write an open source geographical and interactive data visualization for Pirkanmaan Liitto. I won the bid and got to work. The app turned out nice and it was hosted on the website of Pirkanmaan Liitto for a couple of years.

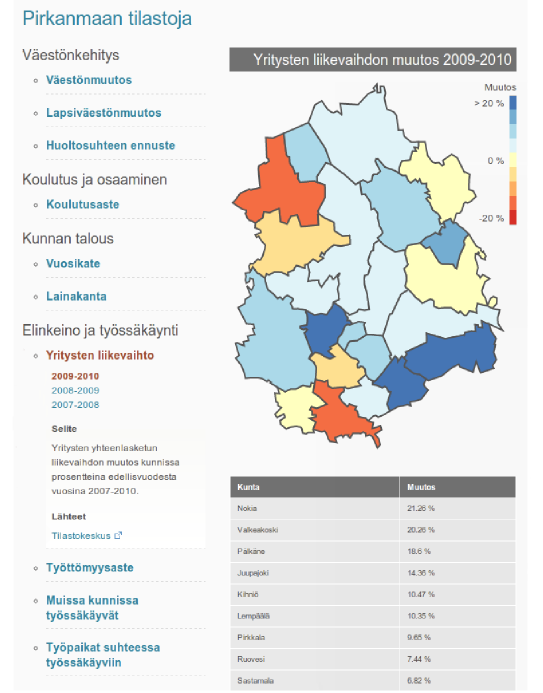
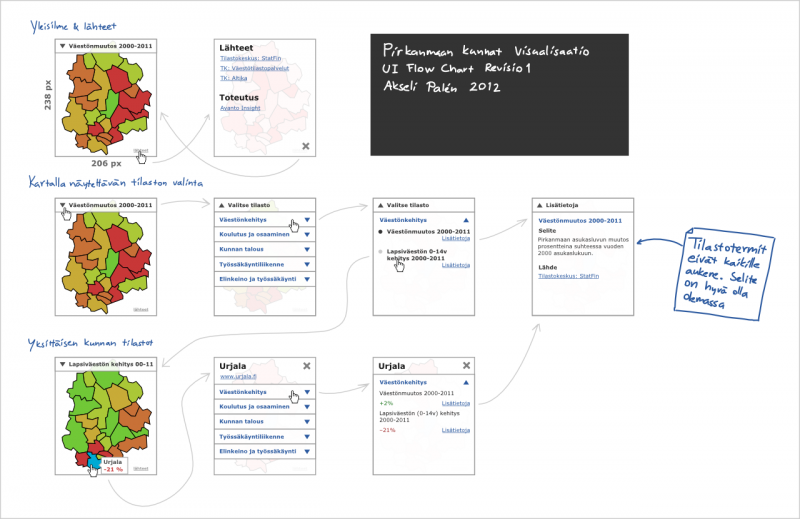
The image above is my original UI design plan and the image below represents the finished application. The app displays statistics for ten topics and each topic has multiple year ranges for citizens to explore.

The open source code is available at github.com/avantoinsight/visu

Image: Each statistics is represented by both geographical and numeric manner. The color range from red to blue was picked over red to green to allow good experience for red-green color blind citizens.
Akseli Palén
Hi! I am a creative full-stack web developer and entrepreneur with strong focus on building open source packages for JavaScript community and helping people at StackOverflow. I studied information technology at Tampere University and graduated with distinction in 2016. I wish to make it easier for people to communicate because it is the only thing that makes us one.

Leave a Comment

Your email address will not be published.